
Service
Land Lease Offer Review
A commercial and financial comparison of utility-scale solar lease offers for Kentucky landowners, with organized questions for your attorney and tax adviser.
Read moreIllustrative scenario
A farm solar lease vs own example: a developer's offer on 180 acres, the crop income it would replace, and a small array sized for eight poultry houses and a grain dryer.
Illustrative scenario. A composite built to show our method. Names, places and figures are hypothetical, not a client record.

The lease offer looked generous until it was set beside the farm's own electric bill.
The setup
Illustrative scenario: a composite built to show our method. Names, places and figures are hypothetical.
The Pruitt family farms in Christian County: eight broiler houses under an integrator contract and about 1,400 acres of corn, soybeans and wheat. A utility-scale solar developer offered to lease 180 of their acres. Separately, they wondered whether solar could cut the power bill for the houses and the grain dryer. This farm solar lease vs own example compares the lease income with the crop income it replaces, then sizes a small array against the farm’s own load. We compared commercial and financial terms only. We don’t give legal advice; the questions at the end went to the family’s attorney and CPA.
The developer holds both extensions. Count the option period and the lease could run 38 years, long enough to pass to the next generation.
The hypothetical net crop return is $230 per acre after direct and overhead costs, before land costs, rising 1.5% a year. That’s $41,400 a year on the 180 acres now and $43,291 in year 4, when rent would be $171,000, about four times as much.
| Path, 30 years | Cumulative income from the 180 acres |
|---|---|
| Keep farming | $1,554,101 |
| Lease, project built | $6,194,252 |
| Lease, option expires unbuilt | $1,578,401 |
If the project is built, the lease dominates. The question is whether it will be. Berkeley Lab’s 2026 interconnection queue report found that about 19% of projects requesting grid interconnection from 2000 through 2020 had reached commercial operation by the end of 2025. A signed lease is one step of many; interconnection, permits and a buyer for the power come later. The family decided to budget around the option payments and treat rent as possible, not promised.
The farm uses about 310,000 kWh a year: roughly 248,000 for the houses, where tunnel fans peak on summer afternoons, 38,000 for dryer and bin fans from September to November, and 24,000 for the shop and office.
The concept is a 120 kW DC ground mount beside the houses, outside the lease area, making about 156,000 kWh a year, half the farm’s use. Two facts shaped the model:
Using our payback estimator method with a hypothetical $2.30 per watt ($276,000), $1,800 a year for upkeep and 2.5% annual rate increases, year-one savings come to $13,650. Payback arrives in year 20, with $205,519 net over 30 years. At 60% on-site use, payback slips to year 23.
If their CPA confirms the farm qualifies for a federal commercial credit, and the array is placed in service by the end of 2027, an illustrative 30% credit would bring payback to year 15. USDA’s REAP program changed significantly in 2026, so the model assumes no grant; the family will check with USDA Rural Development.
For the attorney:
For the CPA:
For the integrator and the co-op: Do you need to approve an array near the houses, and what are the current interconnection and export terms?
Our Land Lease Offer Review organizes these comparisons for real offers.
Hypothetical rent, crop returns, costs and rates, before income tax; none is a market rate. On-farm solar is separate from the 180 acres and could pair with either lease path.
| Series | Yr 1 | Yr 5 | Yr 10 | Yr 15 | Yr 20 | Yr 25 | Yr 30 |
|---|---|---|---|---|---|---|---|
| Keep farming the 180 acres | 41,400 | 213,304 | 443,093 | 690,641 | 957,320 | 1,244,609 | 1,554,101 |
| Lease, project built | 49,500 | 495,792 | 1,421,635 | 2,443,840 | 3,572,436 | 4,818,499 | 6,194,252 |
| Lease, option expires unbuilt | 49,500 | 237,604 | 467,393 | 714,941 | 981,620 | 1,268,909 | 1,578,401 |
| On-farm solar, net of cost | -264,150 | -214,327 | -146,213 | -70,968 | 12,163 | 104,019 | 205,519 |
Related
Service
A commercial and financial comparison of utility-scale solar lease offers for Kentucky landowners, with organized questions for your attorney and tax adviser.
Read more
Farms & Land
14 commercial terms to compare in a Kentucky solar farm lease offer, from rent and escalators to drainage tile and decommissioning, framed for your attorney.
Read more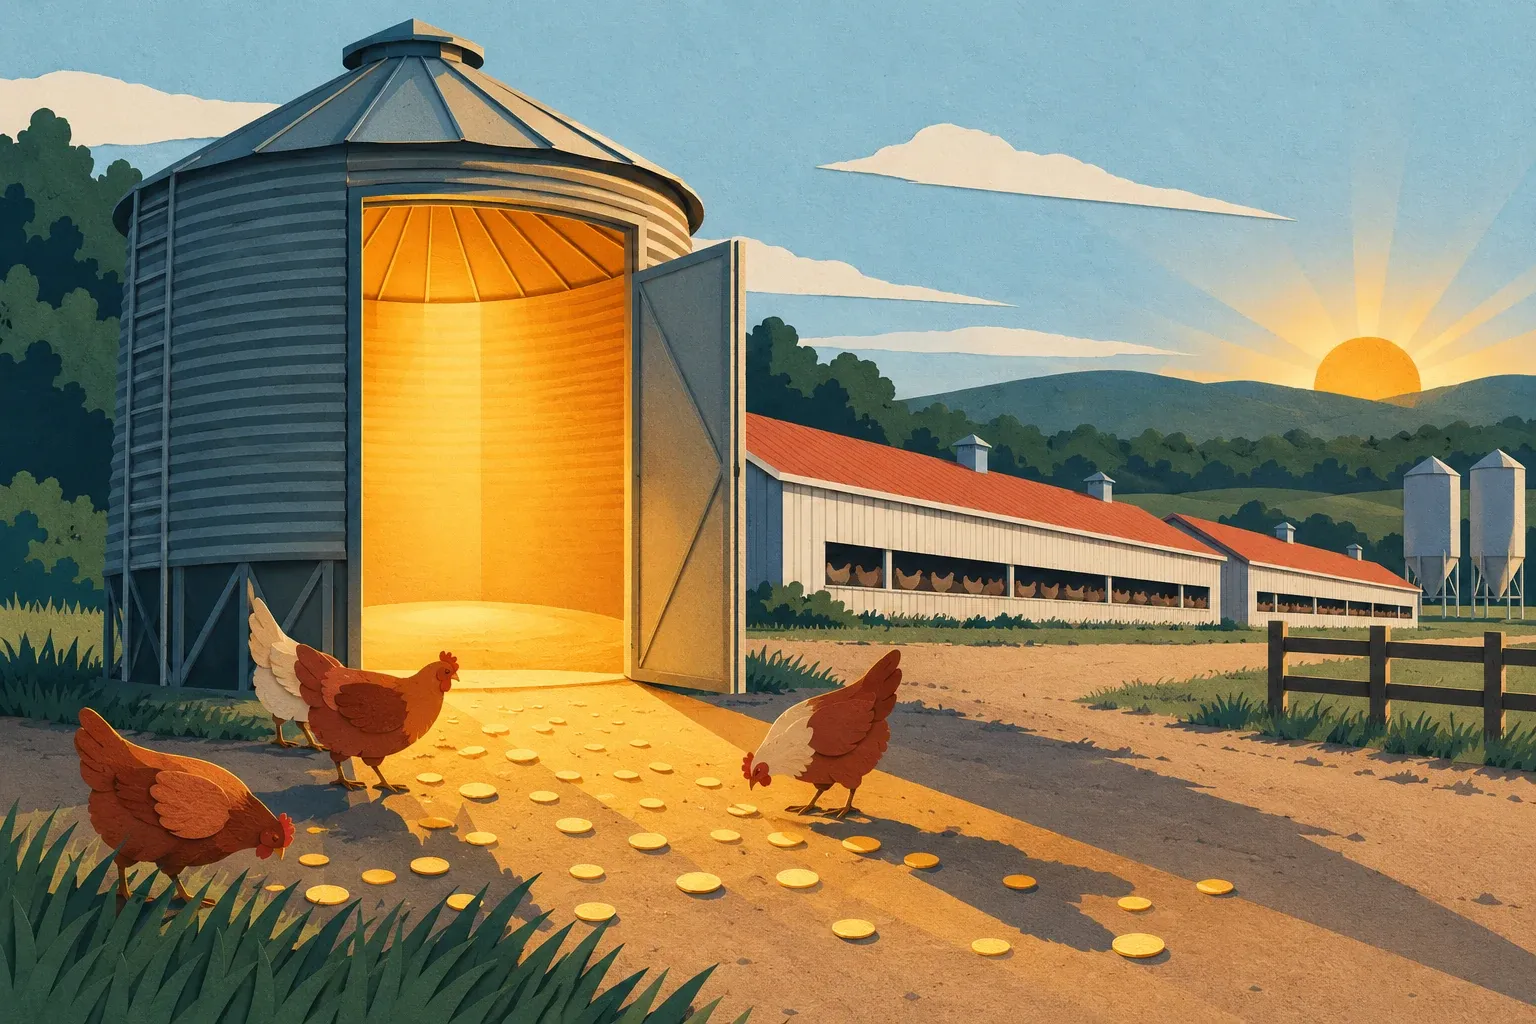
Farms & Land
How fan loads, fall grain drying, co-op meters, demand charges and the 2026 REAP changes decide whether solar pays on a Kentucky poultry or grain farm.
Read more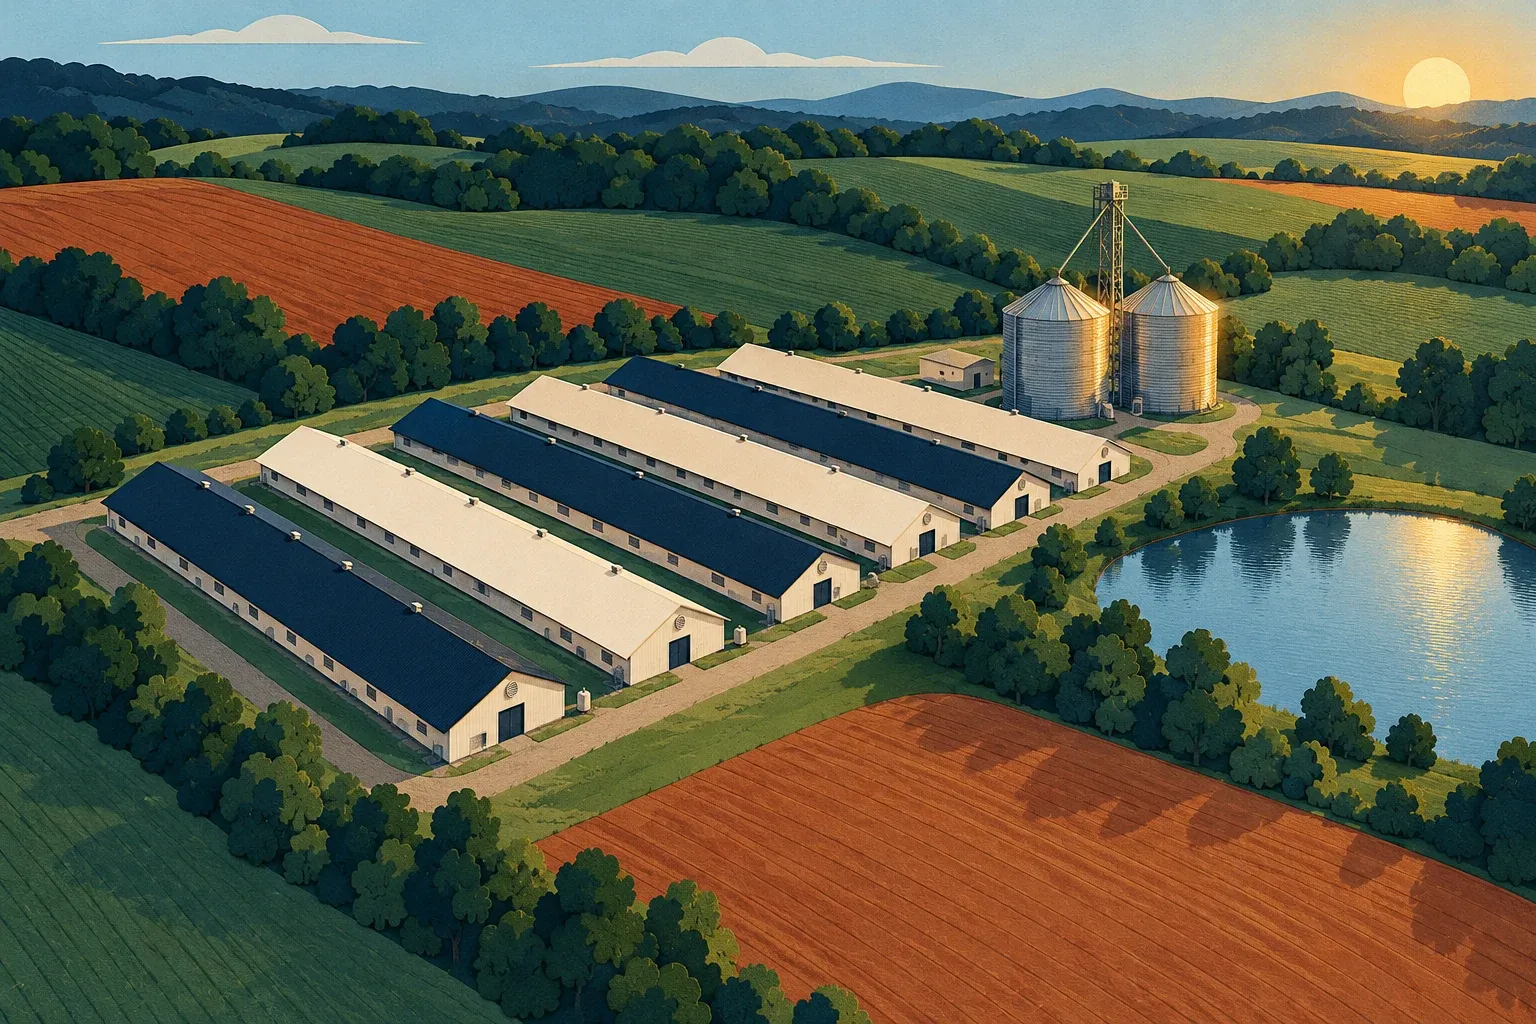
Who we serve
Independent help for Kentucky farm families weighing on-farm solar, comparing land lease offers, and sorting out co-op rules and 2026 program changes.
Read moreNext step
Every scenario here follows the same method we use for real engagements: your documents, explicit assumptions and a plain-English answer.